We have discussed the topic of market surveillance reporting to some depth in previous blogs. e.g.http://www.vamsitalkstech.com/?p=2984. Over the last decade, Global Financial Markets have embraced the high speed of electronic trading. This trend has only accelerated with the concomitant explosion in trading volumes. The diverse range of instruments & the proliferation of trading venues pose massive regulatory challenges in the area of market conduct supervision and abuse prevention. Banks, Broker dealers, Exchanges and other market participants across the globe are now shelling out millions of dollars in fines for failure to accurately report on market abuse violations. In response to this complex world of high volume & low touch electronic trading, global capital markets regulators have been hard at work across different jurisdictions & global hubs e.g. the FINRA in the US, the IROC in Canada and the ESMA in the European Union. Regulators have created extensive reporting regimes for surveillance with a view to detecting suspicious patterns of trade behavior (e.g, dumping, quote stuffing & non bonafide fake orders etc). The intent to increase market transparency on both the buy and the sell side. Based on the scrutiny Capital Markets players are under, a Big Data Analytics based architecture has become a “must-have” to ensure timely & accurate compliance with these mandates. This blog attempts to discuss such a reference architecture.
Business Technology Requirements for Market Surveillance..
The business requirements for the Surveillance architecture are covered at the below link in more detail but are reproduced below in a concise fashion.
Some of the key business requirements that can be distilled from regulatory mandates include the below:
- Store heterogeneous data – Both MiFiD II and MAR mandate the need to perform trade monitoring & analysis on not just real time data but also historical data spanning a few years. Among others this will include data feeds from a range of business systems – trade data, eComms, aComms, valuation & position data, order management systems, position management systems, reference data, rates, market data, client data, front, middle & back office, data, voice, chat & other internal communications etc. To sum up, the ability to store a range of cross asset (almost all kinds of instruments), cross format (structured & unstructured including voice), cross venue (exchange, OTC etc) trading data with a higher degree of granularity – is key.
- Data Auditing – Such stored data needs to be fully auditable for 5 years. This implies not just being able to store it but also putting in place capabilities in place to ensure strict governance & audit trail capabilities.
- Manage a huge volume increase in data storage requirements (5+ years) due to extensive Record keeping requirements
- Perform Realtime Surveillance & Monitoring of data – Once data is collected, normalized & segmented, it will need to support realtime monitoring of data (around 5 seconds) to ensure that every trade can be tracked through it’s lifecycle. Detecting patterns that could perform surveillance for market abuse and monitor for best execution are key.
- Business Rules – Core logic that deals with identifying some of the above trade patterns are created using business rules. Business Rules have been covered in various areas in the blog but they primarily work based on an IF..THEN..ELSE construct.
- Machine Learning & Predictive Analytics – A variety of supervised ad unsupervised learning approaches can be used to perform extensive Behavioral modeling & Segmentation to discover transactions behavior with a view to identifying behavioral patterns of traders & any outlier behaviors that connote potential regulatory violations.
- A Single View of an Institutional Client- From the firm’s standpoint, it would be very useful to have a single view capability for clients that shows all of their positions across multiple desks, risk position, KYC score etc.
A Reference Architecture for Market Surveillance ..
This reference architecture aims to provide generic guidance to banking Business IT Architects building solutions in the realm of Market & Trade Surveillance. This supports a host of hugely important global reg reporting mandates – CAT, MiFiD II, MAR etc that Capital Markets need to comply with. While the concepts discussed in this solution architecture discussed are definitely Big Data oriented, they are largely agnostic to any cloud implementation – private, public or hybrid.
The system needs to process tens of millions to billions of events in a trading window while providing highest uptime guarantees. Batch analysis is always running in the background.
A Hadoop distribution that includes components such as Kafka, HBase and near real time components such as Storm & Spark Streaming provide a good fit for a responsive architecture. Apache NiFi with its ability to ingest data from a range of sources is preferred for it’s ability to support complex data routing, transformation, and system mediation logic in a complex event processing architecture. The capabilities of Hortonworks Data Flow (the enterprise version of Apache NiFi) is covered in the below blogpost in much detail.
Use Hortonworks Data Flow (HDF) To Connect The Dots In Financial Services..(3/3)
A Quick Note on Data Ingestion..
Data volumes in the area of Regulatory reporting can be huge to insanely massive. For instance, at large banks, they can go up to 100s of millions of transactions a day. At market venues such as stock exchanges, they easily enter into the hundreds of billions of messages every trading day. However the data itself is extremely powerful & is really business gold in terms of allowing banks to not just file mundane reg reports but also to perform critical line of business processes such as Single View of Customer, Order Book Analysis, TCA (Transaction Cost Analysis), Algo Backtesting, Price Creation Analysis etc. The architecture thus needs to support multiple ways of storage, analysis and reporting ranging from compliance reporting to data scientists to business intelligence.
Real time processing in this proposed architecture are powered by Apache NiFi. There are five important reasons for this decision –
- First of all, complex rules can be defined in NiFi in a very flexible manner. As an example, one can execute SQL queries in processor A against incoming data from any source (data that isnt from a relational databases but JSON, Avro etc.) and then route different results to different downstream processors based on the needs for processing while enriching it. E.g. Processor A could be event driven and if any data is being routed there, a field can be added, or an alert sent to XYZ. Essentially this can be very complex, equivalent to a nested rules engine so to speak.
- From a Throughput standpoint, a single NiFi node can typically handle somewhere between 50MB/s to 150MB/s depending on your hardware spec and data structure. Assuming 100-500 kbytes of average messages, for a throughput of 600MB/s, the architecture can be sized to about 5-10 NiFi nodes. It is important to note that performance latency of inbound message processing depends on the network, could be extremely small. Under the hood, you are sending data from source to NIfi node (disk), extract some attributes in memory to process, and deliver to the target system.
-
Data quality can be handled via the aforementioned “nested rules engine” approach, consisting of multiple NiFi processors. One can even embed an entire rules engine into a single processor. Similarly, you can define simple authentication rules at the event level. For instance, if Field A = English, route the message to an “authenticated” relationship; otherwise send it to an “unauthenticated” relationship.
-
One of the corner stones in NiFi is called “Data Provenance“, allowing you to have end to end traceability. Not only can the event lifecycle of trade data be traced but you can also track the time at which it happened & the user role who made the change and metadata around why did it happen.
-
Security – NiFi enables authentication at ingest. One can authenticate data via the rules defined in NiFi, or leverage target system authentication which is implemented at processor level. For example, the PutHDFS processor supports kerberized HDFS, the same applies for Solr and so on.
Overall Processing flow..
The below illustration shows the high-level conceptual architecture. The architecture is composed of core platform services and application-level components to facilitate the processing needs across three major areas of a typical surveillance reporting solution:
- Connectivity to a range of trade data sources
- Data processing, transformation & analytics
- Visualization and business connectivity
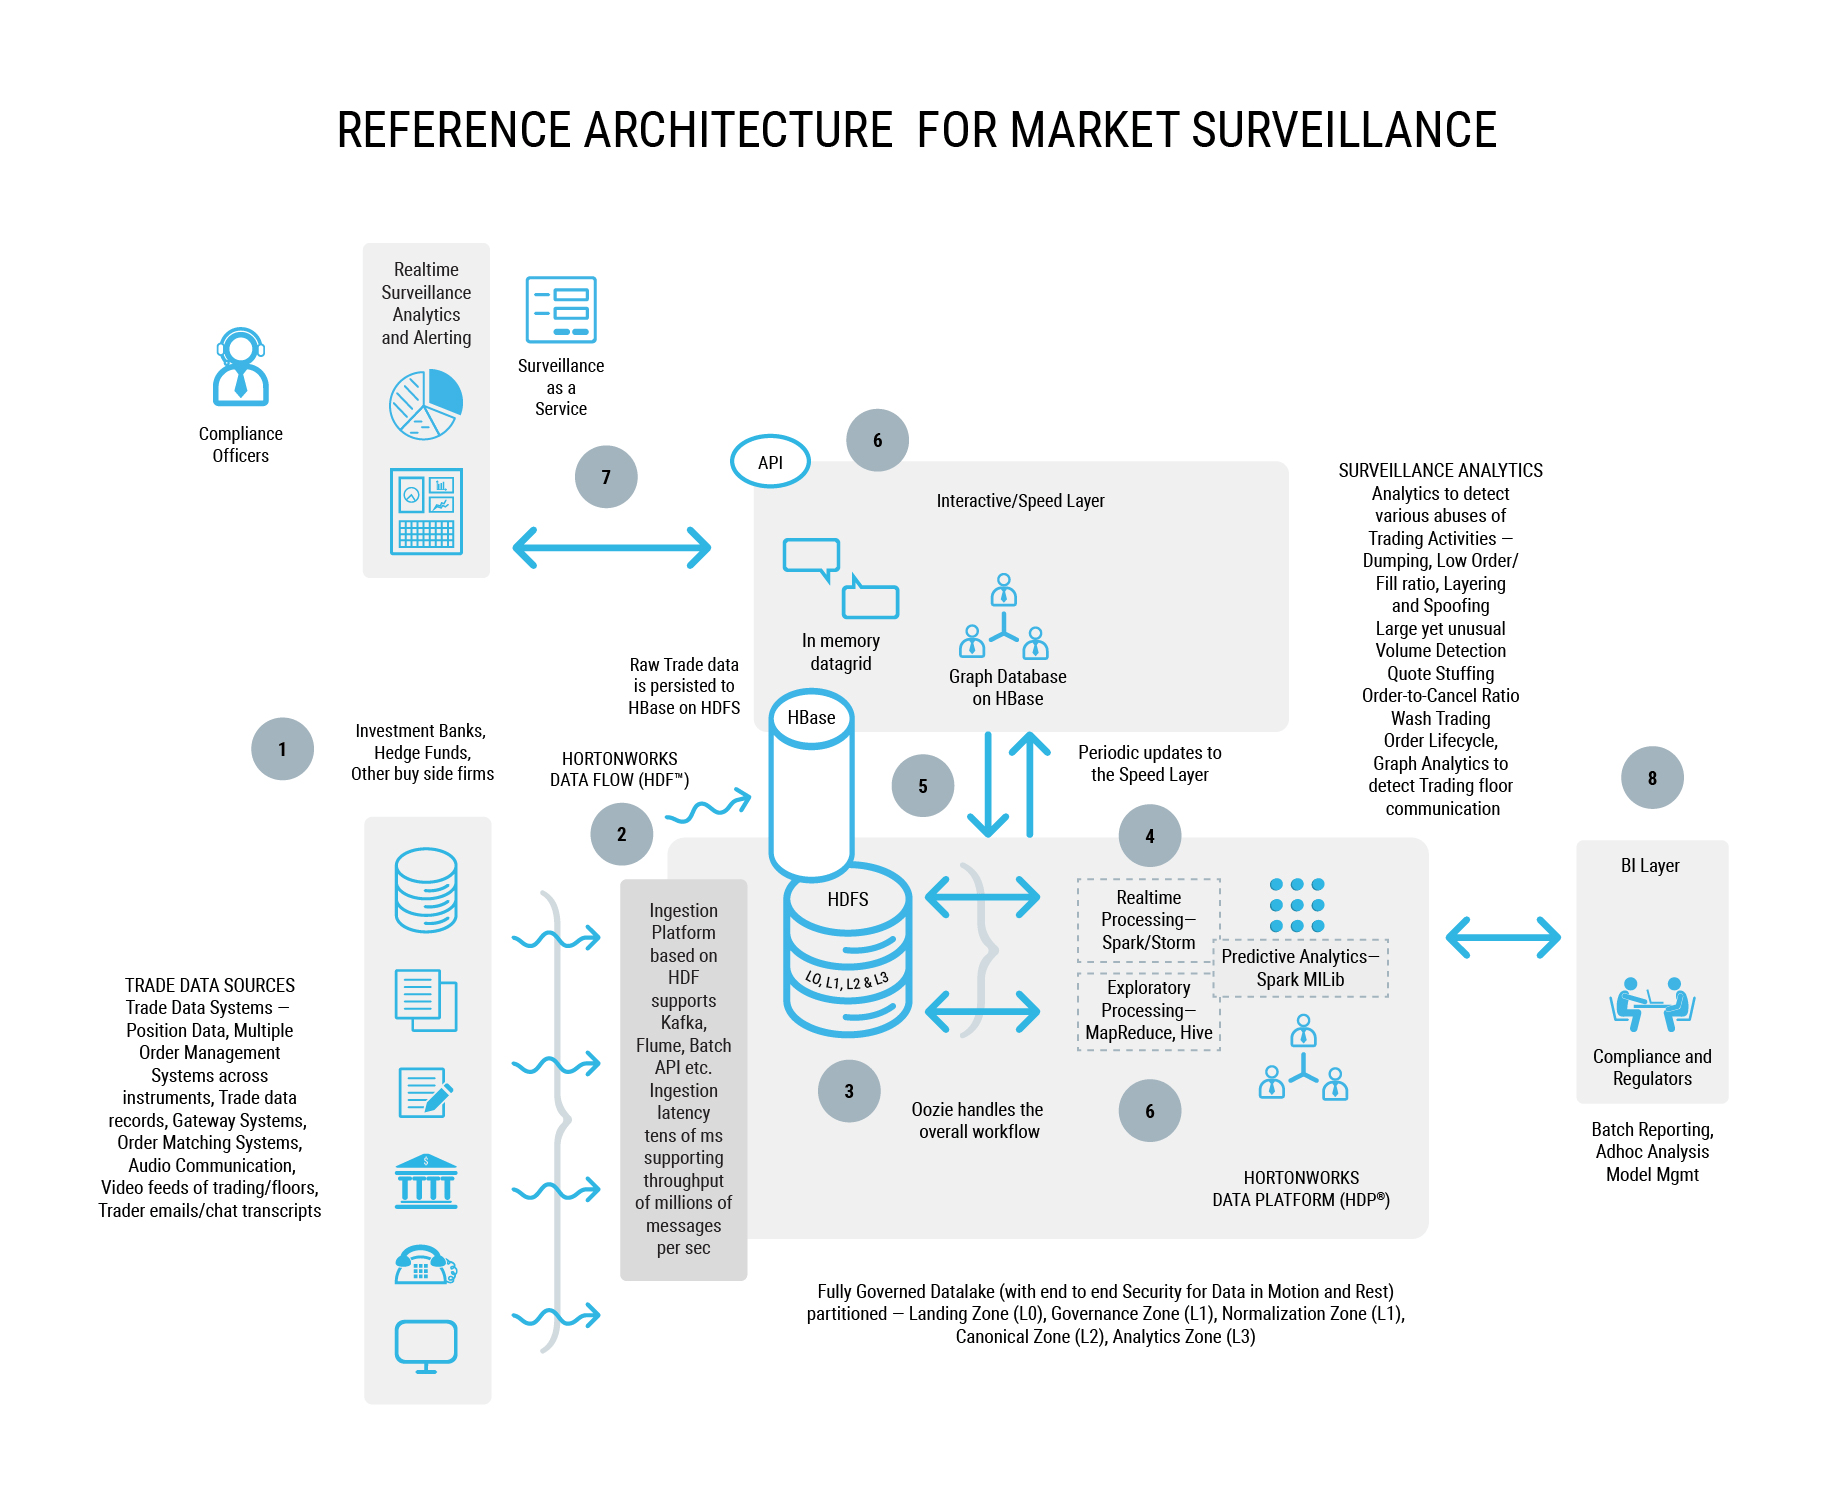
Reference Architecture for Market Surveillance Reg Reporting – CAT, MAR,MiFiD II et al
The overall processing of data follows the order shown below and depicted in the diagram below –
- Data Production – Data related to Trades and their lifecycle is produced from a range of business systems. These data feeds from a range of business systems (including but not limited to) – trade data, valuation & position data, order management systems, position management systems, reference data, rates, market data, client data, front, middle & back office, data, voice, chat & other internal communications etc.
- Data Ingestion – Data produced from the the above layer is ingested using Apache NiFi from a range of sources described above. Data can also be filtered and alerts can be setup based on complex event logic. For time series data support HBase can be leveraged along with OpenTSDB. For CEP requirements, such as sliding windows and complex operators, NiFi can be leveraged along with Kafka and Storm pipeline. Using NiFi will make the process easier to load data into the data lake while applying guarantees around the delivery itself. Data can be streamed in real time as it is created in the feeder systems. Data is also loaded at end of the trading day based on the P&L sign off and the end of day close processes. The majority of the data will be fed in from Book of Record Trading systems as well as from market data providers.
- As trade and other data is ingested into the data lake, it is important to note that the route in which certain streams are processed will differ from how other streams are processed. Thus the ingest architecture needs to support multiple types of processing ranging from in memory processing, intermediate transformation processing on certain data streams to produce a different representation of the stream. This is where NiFi adds critical support in not just handling a huge transaction throughput but also enabling “on the fly processing” of data in pipelines. As mentioned, NiFi does this via the concept of “processors”.
- The core data processing platform is then based on a datalake pattern which has been covered in this blog before. It includes the following pattern of processing.
- Data is ingested real time into a HBase database (which uses HDFS as the underlying storage layer). Tables are designed in HBase to store the profile of a trade and it’s lifecycle.
- Producers are authenticated at the point of ingest.
- Once the data has been ingested into HDFS, it is taken through a pipeline of processing (L0 to L3) as depicted in the below blogpost.
http://www.vamsitalkstech.com/?p=667
- Historical data (defined as T+1) once in the HDFS tier is taken through layers of processing as discussed above. One of the key areas of processing is to run machine learning on the data to discover any hidden patterns in the trades themselves. Patterns that can connote a range of suspicious behavior. Most surveillance applications are based on a search for data that breaches thresholds and seek to match sell & buy orders. The idea is that when these rules are breached, alerts are then generated for compliance officers to conduct further investigation. However this method falls short with complex types of market abuse.A range of supervised learning techniques can then be applied on data such as creating a behavioral profile of different kinds of traders (for instance junior and senior) by classifying & then scoring them based on their likelihood to commit fraud. Thus a range of Surveillance Analytics can be performed on the data. Apache Spark, is highly recommended for near realtime processing not only due to its high performance characteristics but also due to its native support for graph analytics and machine learning – both of which are critical to surveillance reporting.For a deeper look at data science, I recommend the below post.
http://www.vamsitalkstech.com/?p=1846
- The other important value driver in deploying Data Science is to perform Advanced Transaction Monitoring Intelligence. The core idea is to get years worth of Trade data in one location (i.e the datalake) & then applying unsupervised learning to glean patterns in those transactions. The goal is then to identify profiles of actors with the intent of feeding it into existing downstream surveillance & TM systems.
- This knowledge can then be used to constantly learn transaction behavior for similar traders. This can be a very important capability in detecting fraud in traders, customer accounts and instruments.Some of the usecases are –
- Profile trading activity of individuals with similar traits (types of customers, trading desks & instruments, geographical areas of operations etc.) to perform Know Your Trader
- Segment traders by similar experience levels and behavior
- Understand common fraudulent behavior typologies (e.g. spoofing) and clustering such (malicious) trading activities by trader, instrument and volume etc. The goal being to raise appropriate downstream investigation case management system
- Using advanced data processing techniques like Natural Language Processing, constantly analyze electronic communications and join them up with trade data sources to both detect under the radar activity but also to keep the false positive rate low.
- Graph Database – Given that most kinds of trading fraud happens in groups of actors – traders acting in collusion with verification & compliance – the ability to view complex relationships of interactions and the strength of those interactions can be a significant monitoring capability
-
Grid Layer – To improve performance, I propose the usage of a distributed in memory data fabric like JBOSS DataGrid or Pivotal GemFire. This can aid in two ways –
a. Help with fast lookup of data elements by the visualization layer
b. Help perform fast computation process by overlaying a framework like Spark or MapReduce directly onto a stateful data fabric.The choice of tools here is dependent of the language choices that have been made in building the pricing and risk analytic libraries across the Bank. If multiple language bindings are required (e.g. C# & Java) then the data fabric will typically be a different product than the Grid.
Data Visualization…
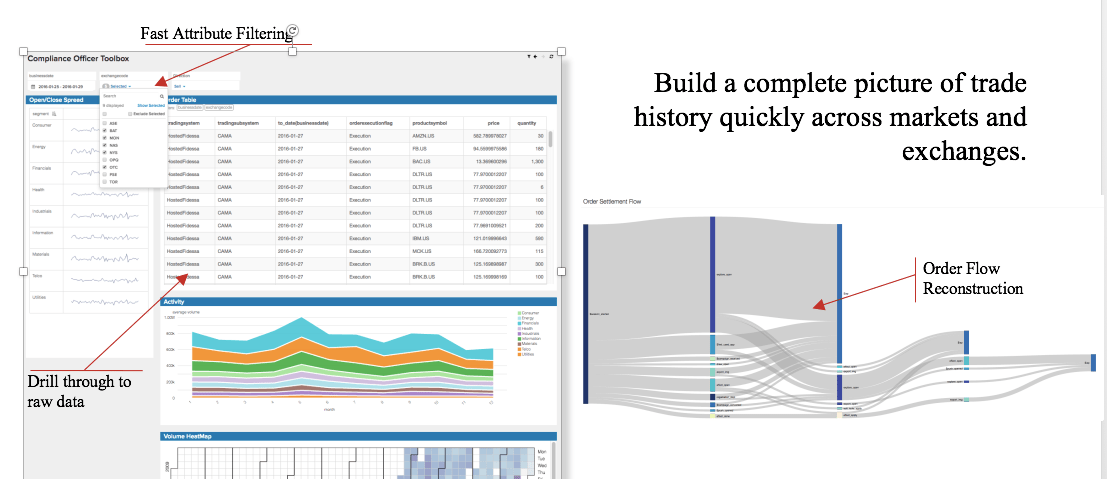
The visualization solution chose shouldI enable the quick creation of interactive dashboards that provide KPIs and other important business metrics from a process monitoring standpoint. Various levels of dashboard need to be created ranging from compliance officer toolboxes, executive dashboard to help identify trends and discover valuable insights.

Compliance Officer Toolbox (Courtesy: Arcadia Data)
Additionally, the visualization layer shall provide –
a) A single view of Trader or Trade or Instrument or Entity
b) Investigative workbench with Case Management capability
c) The ability follow the lifecycle of a trade
d) The ability to perform ad hoc queries over multiple attributes
e) Activity correlation across historical and current data sets
f) Alerting on specific metrics and KPIs
To Sum Up…
The solution architecture described in this blogpost is designed with peaceful enterprise co-existence in mind. In the sense, it interacts and is also integrated with a range of BORT systems and other enterprise systems such as ERP, CRM, legacy surveillance systems. This includes all and any other line of business solutions that typically exist as shared enterprise resources (such as CRM or ERP systems or other line-of-business solutions).
1 comment
The impact of Mifid is tremendous. Investment Banks and Financial Service firms are looking for IT- Consultants to help implementing the directives.